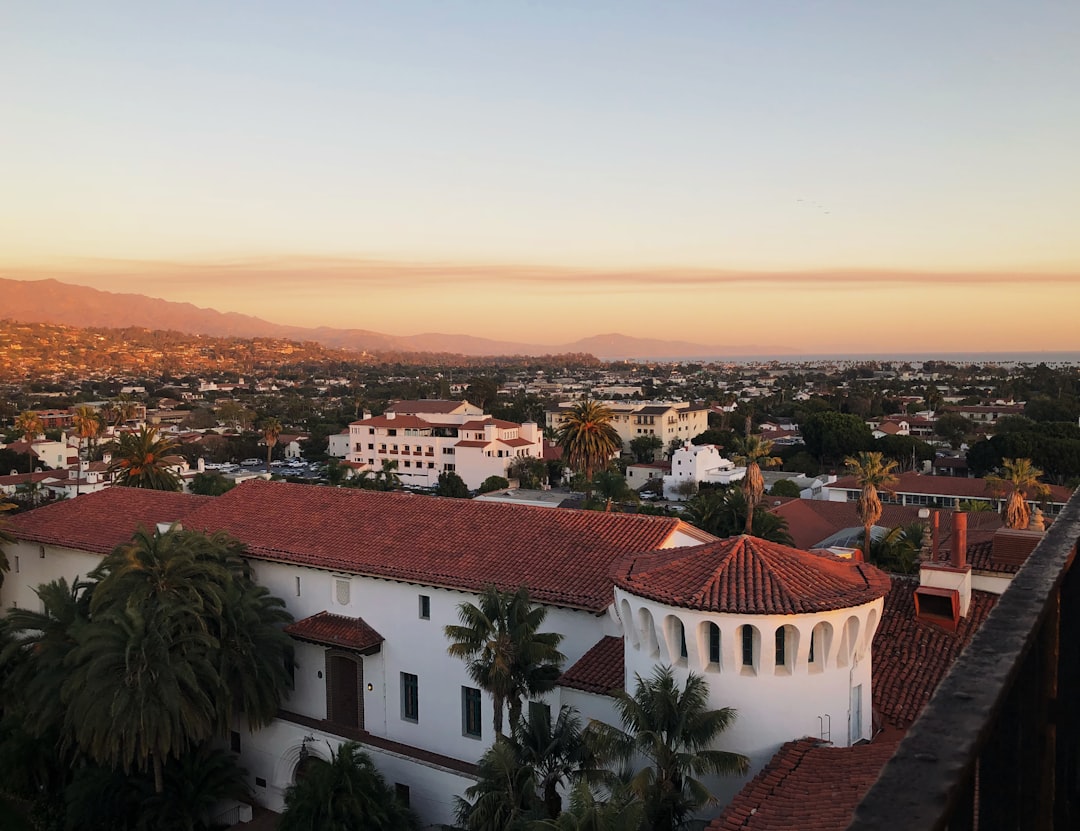
Photo of Glendora, California
Photo by Carl Newton on Unsplash

City in California, United States

Glendora

$870kMedian Home
343Days with 5+ hrs sun
77°FAvg High Temp
Loading Weather
View on MapPopulation52kCenter elevation774 ft
Right now

Weather & Forecast

Quick Read

Glendora is a city in the San Gabriel Valley in Los Angeles County, 25 miles (40 km) northeast of Downtown Los Angeles. As of the 2020 census, the population of Glendora was 52,558. World-famous Route 66 runs through the city. Like many of its neighbors, Glendora was founded during the Southern California real estate boom of the 1880s.Wikipedia

Temperatures vary across four distinct seasons. Most rain falls in winter. Spring and fall feel like real transition seasons. Humidity stays fairly steady through the year. Air quality can be a watchout.

Four seasonsMild winter temperaturesWinter rainPride of the Foothills
Compare next

See how Glendora stacks up before you commit.

Start a comparison
Local help

Find practical next steps in Glendora.

AD

Housing, movers, and local services for people who are past browsing and starting to plan.

View local directory
Place

Where It Is

Location Context
Glendora, California
Latitude34.14°
Longitude-117.87°
Population52k
Center elevation774 ft

State Context

CaliforniaU.S. state

California is a state in the Western United States. It is bordered by Oregon to the north, the Mexican state of Baja California to the south, Nevada to the east, Arizona to the southeast, and the Pacific Ocean to the west. With a population of over 39 million across an area of 163,696 square miles (423,970 km2), it is the most populous U.S. state and the third largest by land area.Wikipedia

Income tax: 1.00% - 14.40%Avg sales tax: 8.85%Property tax: 0.69%Official school data available

About the Region

California

California includes coastal metropolitan areas, the Central Valley, mountain communities, and desert cities. The Bay Area and Los Angeles are major urban examples, but neither represents the full range of places within the state.

Coastal influence, elevation, and inland location can produce very different temperature and rainfall patterns. Housing costs, transport, and access to services vary between cities and neighborhoods. Use the city’s own figures rather than treating statewide conditions as a local forecast or budget.

Outdoors

Nearby Parks & Nature

Nature & Park Feeds

Closest protected landscapes, reserves, and big park systems surfaced from the same nearby feeds used in compare.

Distances in miles
National Park Service feed

Federal Park Sites

Loading nearby nature feeds...
OpenStreetMap feed

Local Nature & Reserves

Loading nearby nature feeds...
Sources: National Park Service and OpenStreetMap
People

City Profile

Median Age40 yrs
College Educated37%bachelor's or higher
Work From Home13%of workforce
Poverty Rate7%
Practical

Housing Costs & Income

Housing
$2,769/mo
Median rent
$870k
Median home price
Rent burden31% of income
Household Income
$107k
Median annual
Daily life

Livability

Getting AroundMixed mobility
Citywide Walk Score plus available transit and density context

Mixed day-to-day convenience.

Safety Score
74
Walk Score
47
Transit Score
32
School Rating
7.7/10
Internet
No internet coverage data yet.
The year

Climate Through the Year

Sunshine
343
days with 5+ hours of sun/year

Annual average of days with more than five hours of sunshine, not necessarily clear skies.

94% of the year
Avg High Temp
77°F
annual average
Humidity Pattern
Steady humidity
55% warm season / 61% cool season
Comfort Score
86/100
Excellent
Temp Swing
30°F
seasonal high-temp spread
Annual precipitation
31"
inches per year
Annual snowfall
2"
inches per year
Typical Air Quality
75
Moderate · 2024 modeled average
How To Read Comfort

Comfort combines temperature band fit, humidity fit, seasonal swing, and penalties for long stretches of extreme heat or cold. Higher scores mean the yearly pattern stays closer to an easier day-to-day climate band.

Monthly Temperature
Daylight Span (Sunrise to Sunset)
Precipitation Distribution
31" of precipitation per year
Jan
Feb
Mar
Apr
May
Jun
Jul
Aug
Sep
Oct
Nov
Dec
Humidity Through The Year
Hover any month for the exact RH value. This is measuring monthly relative humidity, not dew point or current weather.
fairly steady humidity
Summer 57% · Winter 57% · Nov-May 46-69%
Jan
Feb
Mar
Apr
May
Jun
Jul
Aug
Sep
Oct
Nov
Dec
Hover a month for exact RH and seasonal context.
Watchouts

Natural Hazard Risk

Flood Risk
minimal
FEMA classification
Wildfire Risk
minimal
FEMA rating
Poor Air Days
82 days
per year with AQI > 100
Local directory

Local Next Steps

Local directory

Housing and local help for a move to Glendora

Real estate, rentals, moving help, and everyday local businesses for people taking a serious look at Glendora. Sponsored placements are clearly labeled and never influence the city data.

Featured local sponsorAD
Be the first local name people see in Glendora
A prominent city-page placement for a useful local business, real estate team, or relocation service.
One featured city sponsor slot is available here.
Real estate & rentalsAD
Answer the housing question in Glendora
For agents, brokerages, apartment groups, furnished rentals, and housing teams.
Moving & logisticsAD
Catch people at the practical moment
For movers, storage, shipping, car transport, and relocation logistics.
Local services & favoritesAD
Anything useful in Glendora
Pizza joints, local lenders, insurers, cleaning services, coffee shops, and other everyday local businesses.
Next move

Keep Exploring

Compare Glendora with other cities

Stack it side-by-side against cities you're considering.

Quick Compare