


The Cooler City Is Not Necessarily the Cheaper City
Moving to Arizona can mean choosing a place where January feels like an invitation to go outside, or one where winter comes with freezing nights. It can mean accepting intense summer heat, or paying more for a city that largely escapes it.
That last trade-off is easy to miss. In the same December 2025 housing snapshot, Flagstaff and Prescott had higher asking-rent and home-value indices than Phoenix or Tucson. The smaller, cooler choice was not the cheaper one.
So the useful question is not simply whether you would like Arizona. It is which version of Arizona you want, and what you are willing to trade for it.
Four Cities, Two Very Different Seasons
| City | January | July |
|---|---|---|
| Phoenix | 65 / 41 | 107 / 85 |
| Tucson | 63 / 40 | 101 / 79 |
| Prescott | 48 / 31 | 89 / 69 |
| Flagstaff | 39 / 22 | 84 / 61 |
Temperature basis: WhyThere's stored Open-Meteo archive series. These are average daily highs and lows, not extremes or 30-year station normals. An overnight low does not tell you the temperature at dinner time.
The contrast is more revealing when you look at both seasons. Flagstaff's average July high in this series is slightly below Phoenix's average July low. But its January low is also 19 degrees colder.
Prescott occupies the space between those experiences. Tucson, meanwhile, is cooler than Phoenix without becoming a mountain-climate alternative. A July average high of 101 F is still a serious summer-heat commitment.
Phoenix: Choose the Winter, Plan for the Summer
Phoenix makes the clearest case for someone who wants mild winter afternoons and can organize life around hot summers. The harder number to overlook is not just July's 107 F average high. It is the 85 F average low: even the coolest part of a typical summer day offers limited relief.
For a prospective move, that shifts attention from a city's annual average to the home and the routines around it. How well does the cooling work? Is parking shaded? What does the walk from your front door to the places you use actually involve in July?
Phoenix also complicates the assumption that leaving the big city saves money. Its housing indices were below both mountain candidates in this snapshot. That does not settle the full household budget, but it means you should not dismiss it as the expensive option before comparing actual homes.
Tucson: Less Heat Than Phoenix, Not an Escape From Heat
Tucson had the lowest housing indices of these four cities, alongside July highs and lows six degrees below Phoenix's. That is a meaningful difference, but it is a difference within a hot summer climate.

It also offers a concrete way to investigate a more compact daily routine. The Sun Link streetcar connects the Mercado district, downtown, Fourth Avenue, Main Gate Square and the University of Arizona along a 3.9-mile route. A home near that corridor presents a different set of everyday possibilities from one far from it.
That is not a claim that all of Tucson works without a car. It is a useful starting point for choosing where to look: test whether the places you would actually visit line up with the corridor, rather than relying on a citywide score.
Prescott: The Middle Climate Has Its Own Price
Prescott offers a substantial step down in summer heat without going as far into winter cold as Flagstaff. Its July average high was 18 degrees below Phoenix's in this series; its January average low was near freezing.
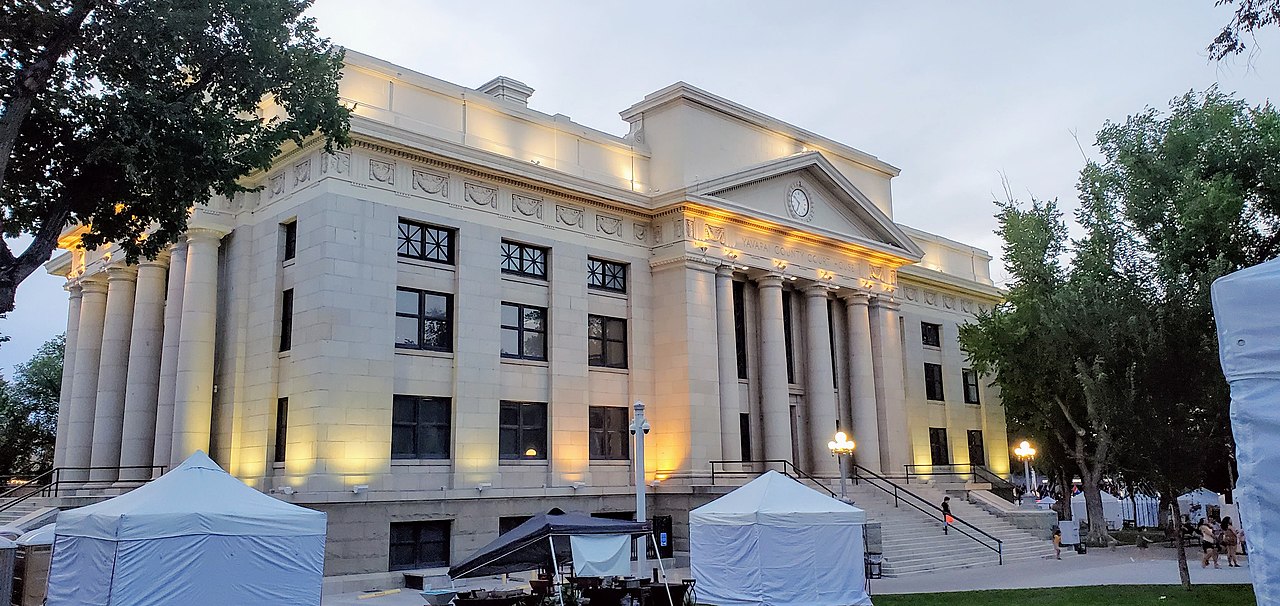
But the housing comparison is less gentle. Prescott's asking-rent index was $212 a month above Phoenix's, and its home-value index was about $192,000 higher. Those are city-level indices, not prices for equivalent properties, but they challenge the idea of Prescott as a straightforward lower-cost escape.
It is worth considering when the climate trade-off itself is valuable to you. It is less convincing if the whole plan depends on cooler weather automatically coming with cheaper housing.
For a closer look at the seasonal change, read Phoenix to Prescott: How Much Heat Can You Leave Behind? That article uses a separate, explicitly identified set of NOAA airport normals.
Flagstaff: Summer Relief, Winter Responsibilities
Flagstaff delivers the strongest summer contrast in this group. July's 84 F average high and 61 F average low describe a very different season from Phoenix's. January's 39 / 22 F averages make clear that this is not simply Phoenix with the unpleasant months removed.

The housing figures add another constraint. Flagstaff had the highest asking-rent and home-value indices of the four. Its rent index was $534 a month above Phoenix's in the matched snapshot.
Treat winter logistics as part of the housing search, not something to figure out after signing. Ask about snow removal, heating and parking, and check the city's winter parking guidance. The summer you want comes attached to a whole year of living there.
What the Housing Comparison Actually Says
| City | Monthly asking-rent index | Typical home-value index |
|---|---|---|
| Phoenix | $1,561 | $402,796 |
| Tucson | $1,401 | $318,643 |
| Prescott | $1,773 | $594,576 |
| Flagstaff | $2,095 | $646,275 |
ZORI measures asking rents; ZHVI measures typical home values. These are not current listings, median sale prices, equivalent homes or a complete cost-of-living budget. Values are rounded to whole dollars and matched by city and state. Source: Zillow Research data and methodology.
The pattern is useful without pretending to explain everything. Both cooler mountain cities were more expensive on these housing measures. That does not prove cooler weather caused the difference, or that every household would spend more there. It does mean climate and housing belong in the same decision.
Compare the Life, Not Just the City
Start with two ordinary days: one in July and one in January. Where would you live, how would you get around, and which outdoor activities would you actually keep doing? Then price a plausible home for that routine.
Phoenix puts the biggest summer-heat demand on that plan. Tucson reduces it without removing it. Prescott trades much of that heat for colder winters and higher housing indices. Flagstaff goes furthest toward summer relief, with the strongest winter and housing trade-offs in this group.
Next, compare all four cities, then narrow the search to real addresses. The tables above retain their stated historical periods; the live comparison can change as stored facts are refreshed. Our property-level climate-risk checklist covers questions a city average cannot answer. For the administrative side of a move, use Arizona's official new-resident motor vehicle guidance.


